
Reports that show your real numbers, not just data
You already have the data. It lives in your purchase orders, invoices, work orders, and timesheets. Statim ERP pulls it together into 11 built-in report types, exportable as PDF, Excel, HTML, or JSON. No data warehouse. No BI tool. Just the numbers you need, in a format you can actually use.
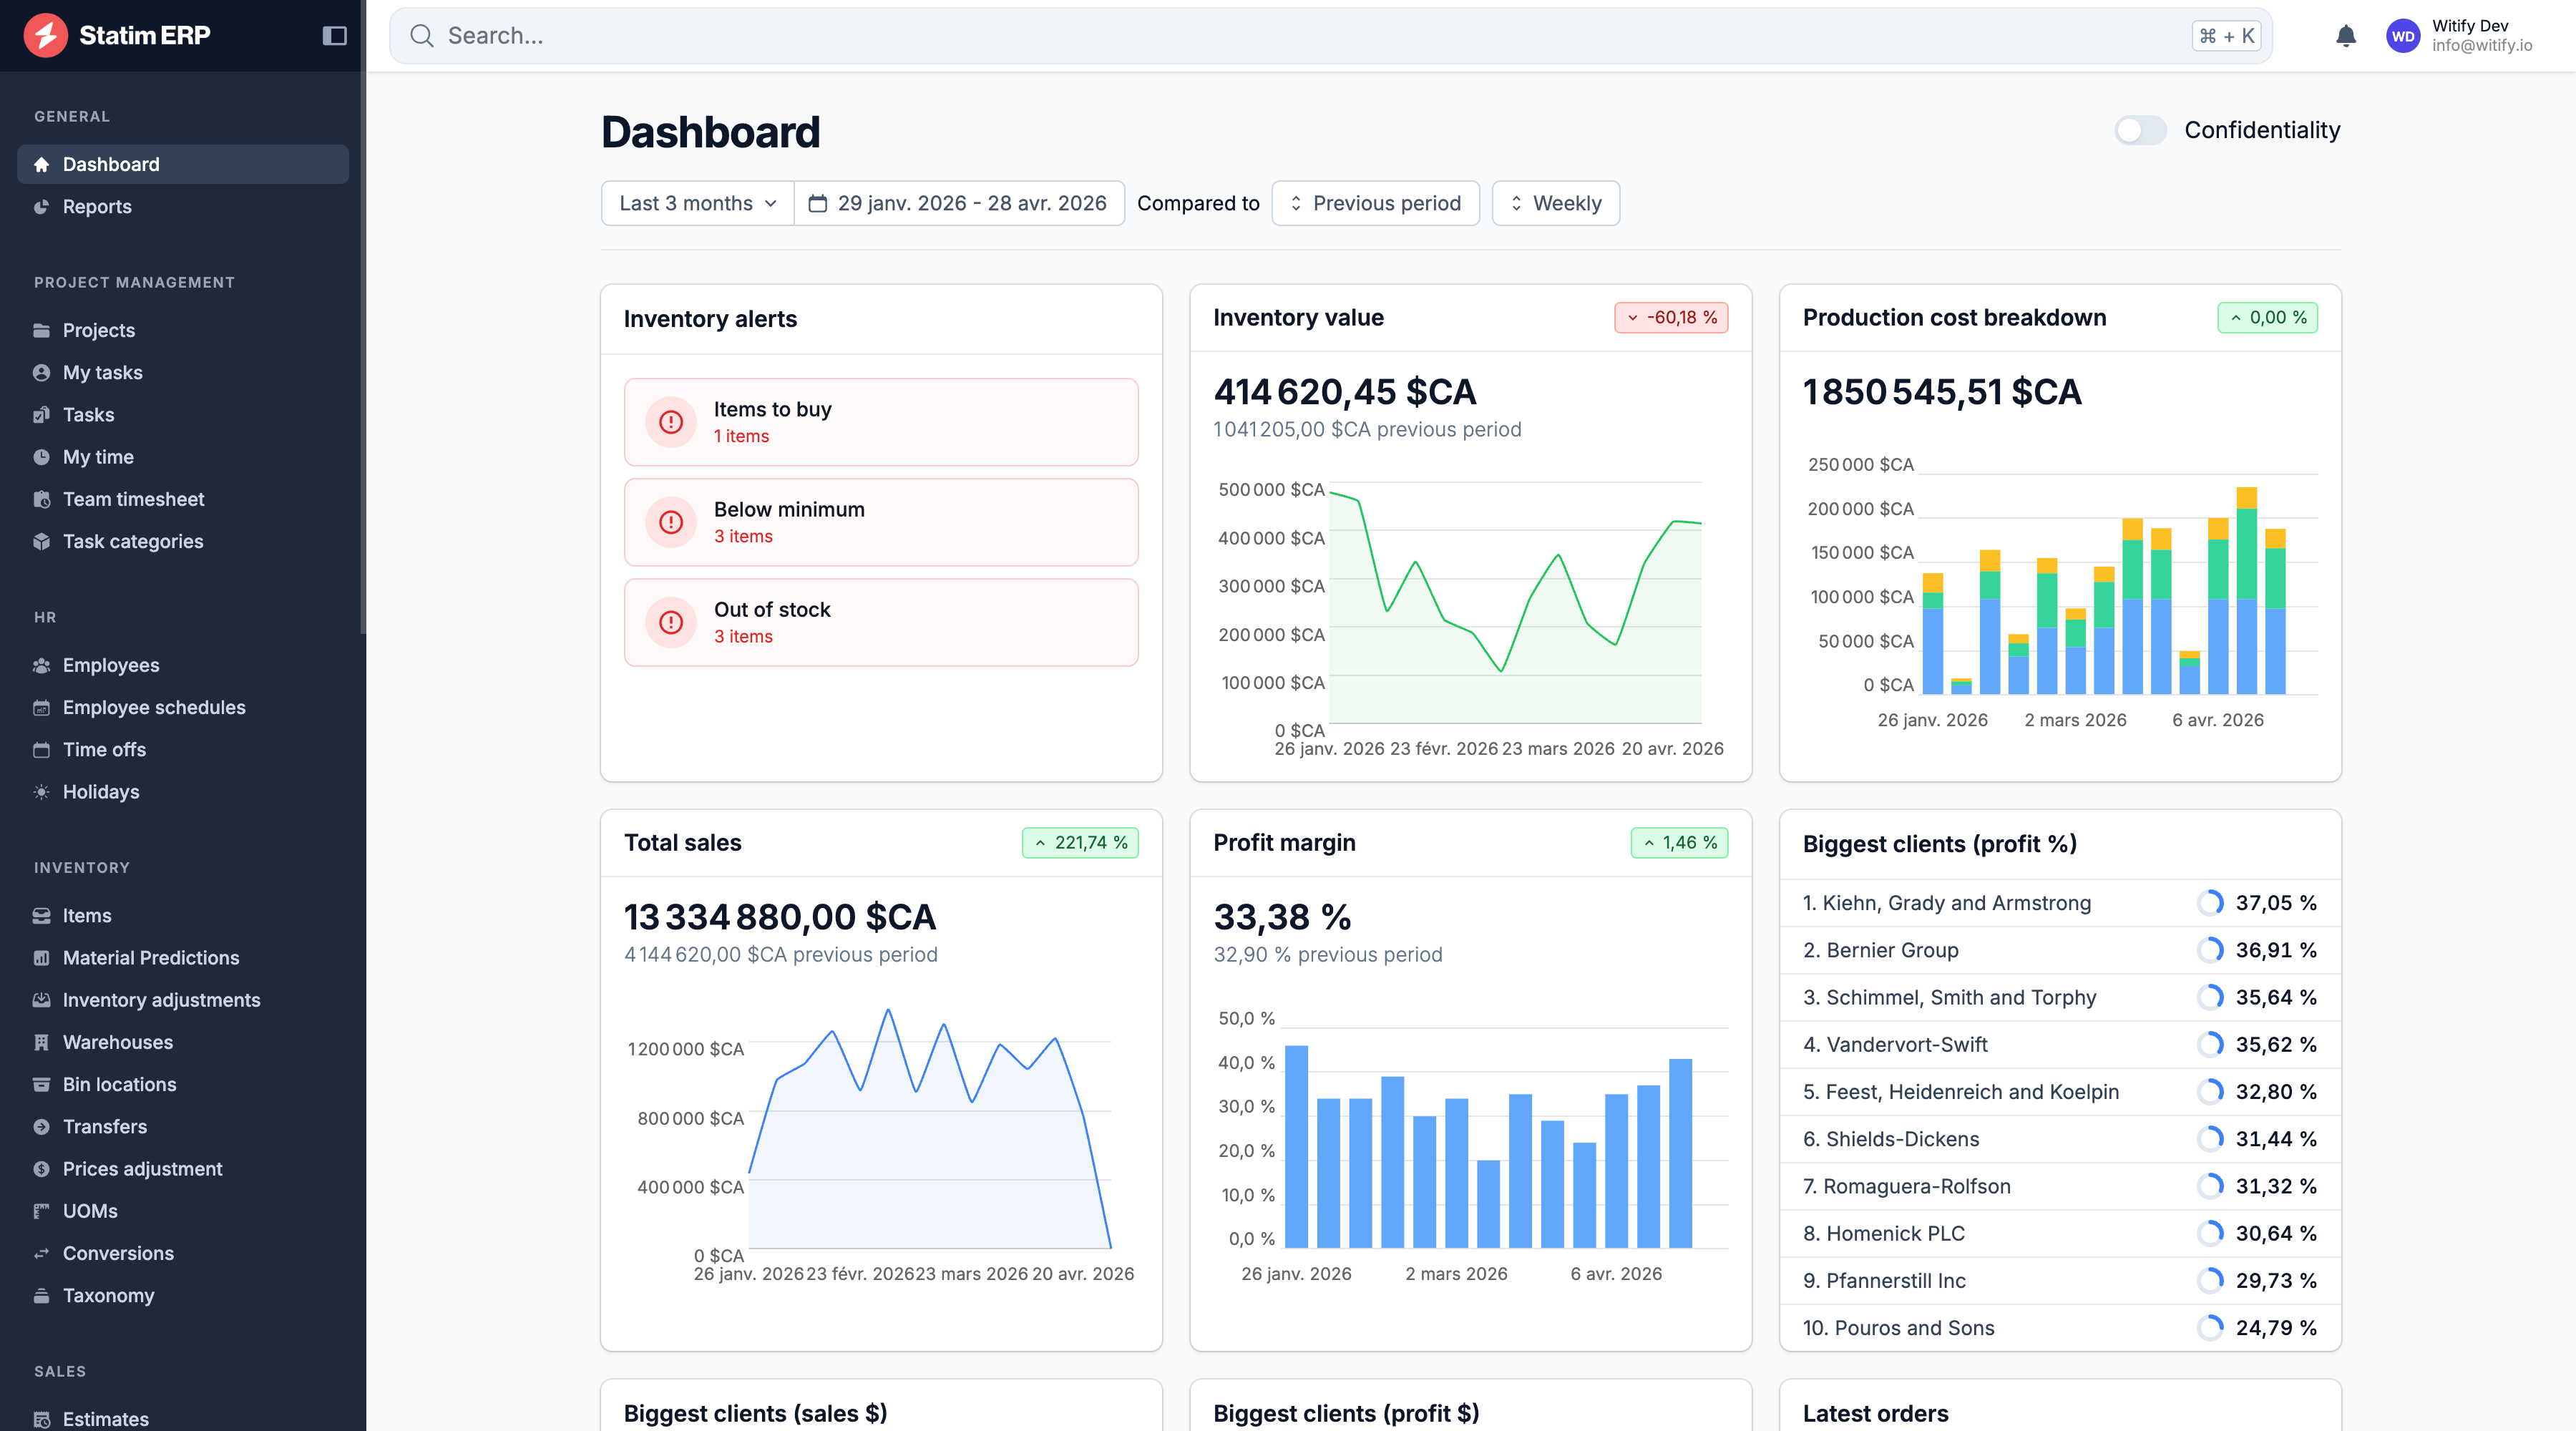
Reporting that covers your entire operation, not just one corner of it
Reports across every module
Sales, purchasing, manufacturing, time tracking, inventory. Each report is built on live transactional data, not stale exports. The numbers match because they come from the same system that runs your business.
Four export formats, five paper sizes
Every report exports to PDF, Excel, HTML, and JSON. Configure paper size (Letter, A2, A3, A4, A5) and orientation (portrait or landscape). Hand your controller a PDF. Drop the Excel into a board deck. Send the JSON to another system.
Time-series analytics on every model
The analytics engine groups data by day, week, month, or year and applies count, sum, or average aggregation. It supports cumulative and retroactive modes. Built into your dashboard, item pages, and every major module.
Balance sheet and P&L, pulled straight from your books
Asking your accountant to run a report should not take three days and a follow-up email. Statim ERP pulls your balance sheet and profit & loss statement directly from your accounting software, rendered in the same interface you use for everything else. Filter by date range, view as HTML in the browser, or download a PDF. The numbers come from your accounting system. You read them inside your ERP.
Balance Sheet
Assets, liabilities, and equity broken down into a full hierarchical view. Filter by any date range to see your financial position at a point in time. Download as PDF for board meetings or review inline.
Profit & Loss Statement
Revenue and expense detail with full category breakdown. Pick a period, run the report, and see where the money went. Same data your accountant sees in your accounting software, without needing a separate login.
Permission-controlled access
Financial reports are gated behind individual permissions. Your operations manager can run sales reports without seeing the balance sheet. Each of the 11 report types has its own permission toggle.
See where your margin lives. And where it disappears.
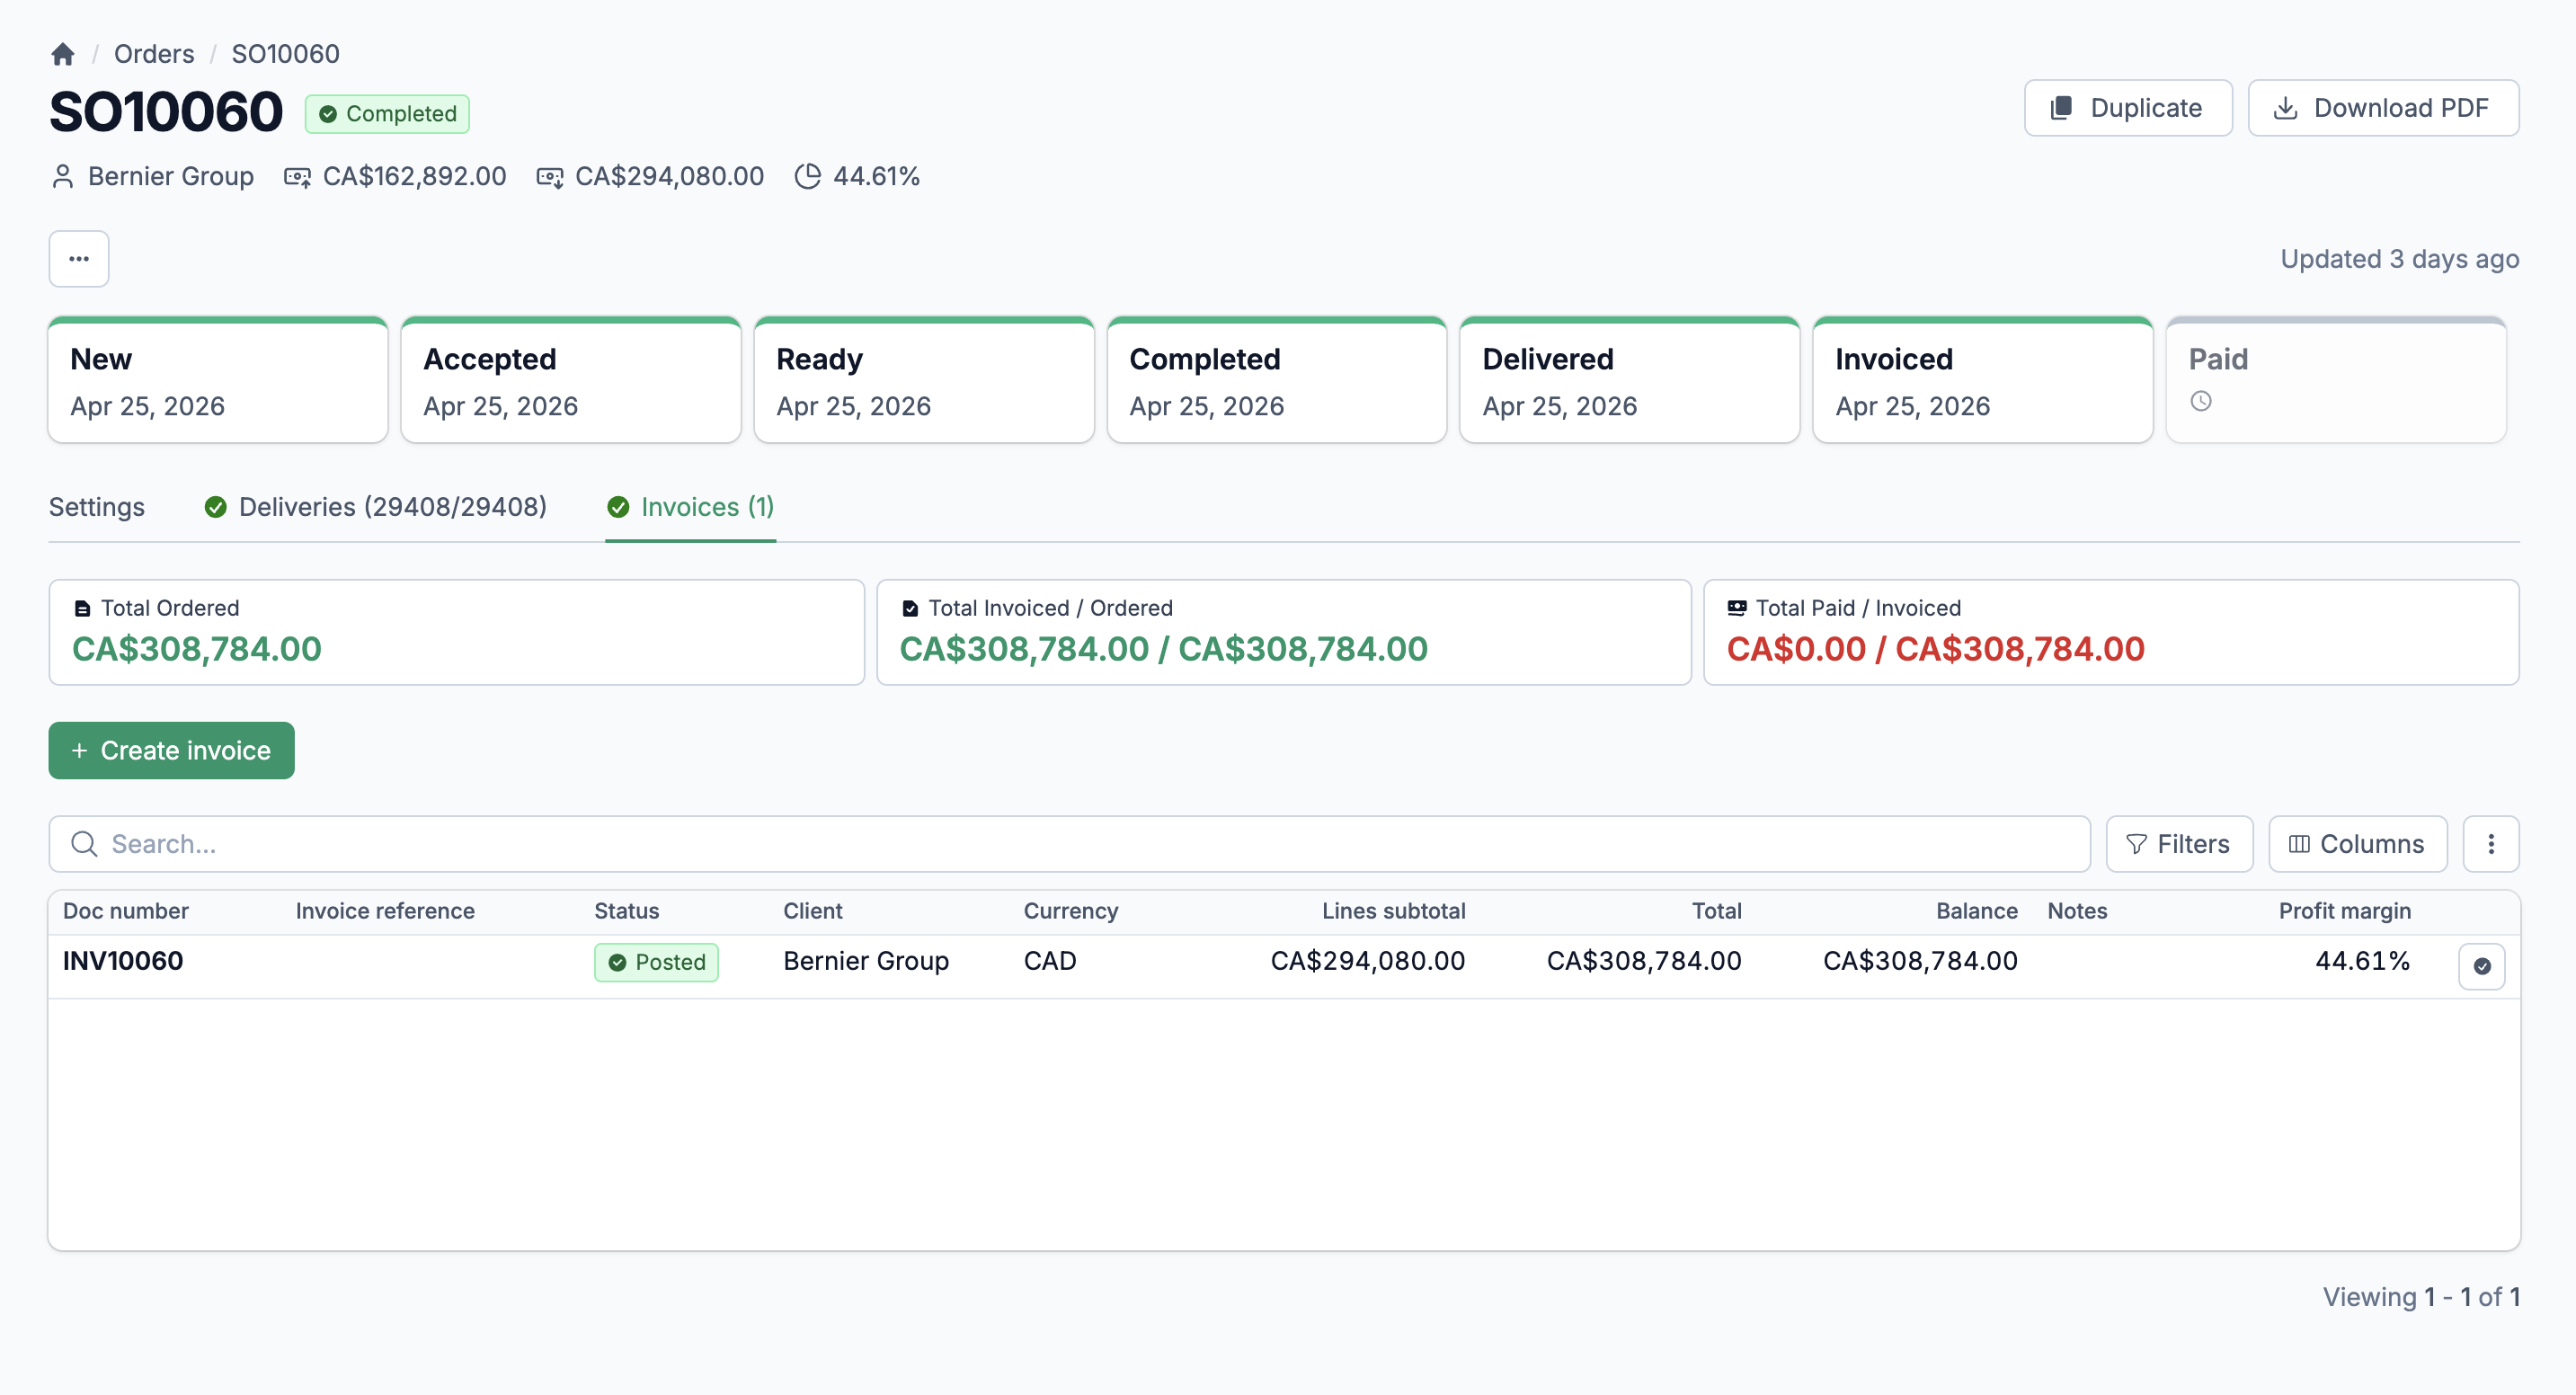
Three sales reports give you different angles on the same question: are you making money? The Sales & Profitability by Client report shows revenue, cost, and profit margin per client, broken down by item category. The Details of Sales & Profitability report goes line by line across invoices. The Credits by Client report tracks credits issued and their after-tax totals. Filter by date range, client, or client opening date. Every column is sortable. Every report is exportable.
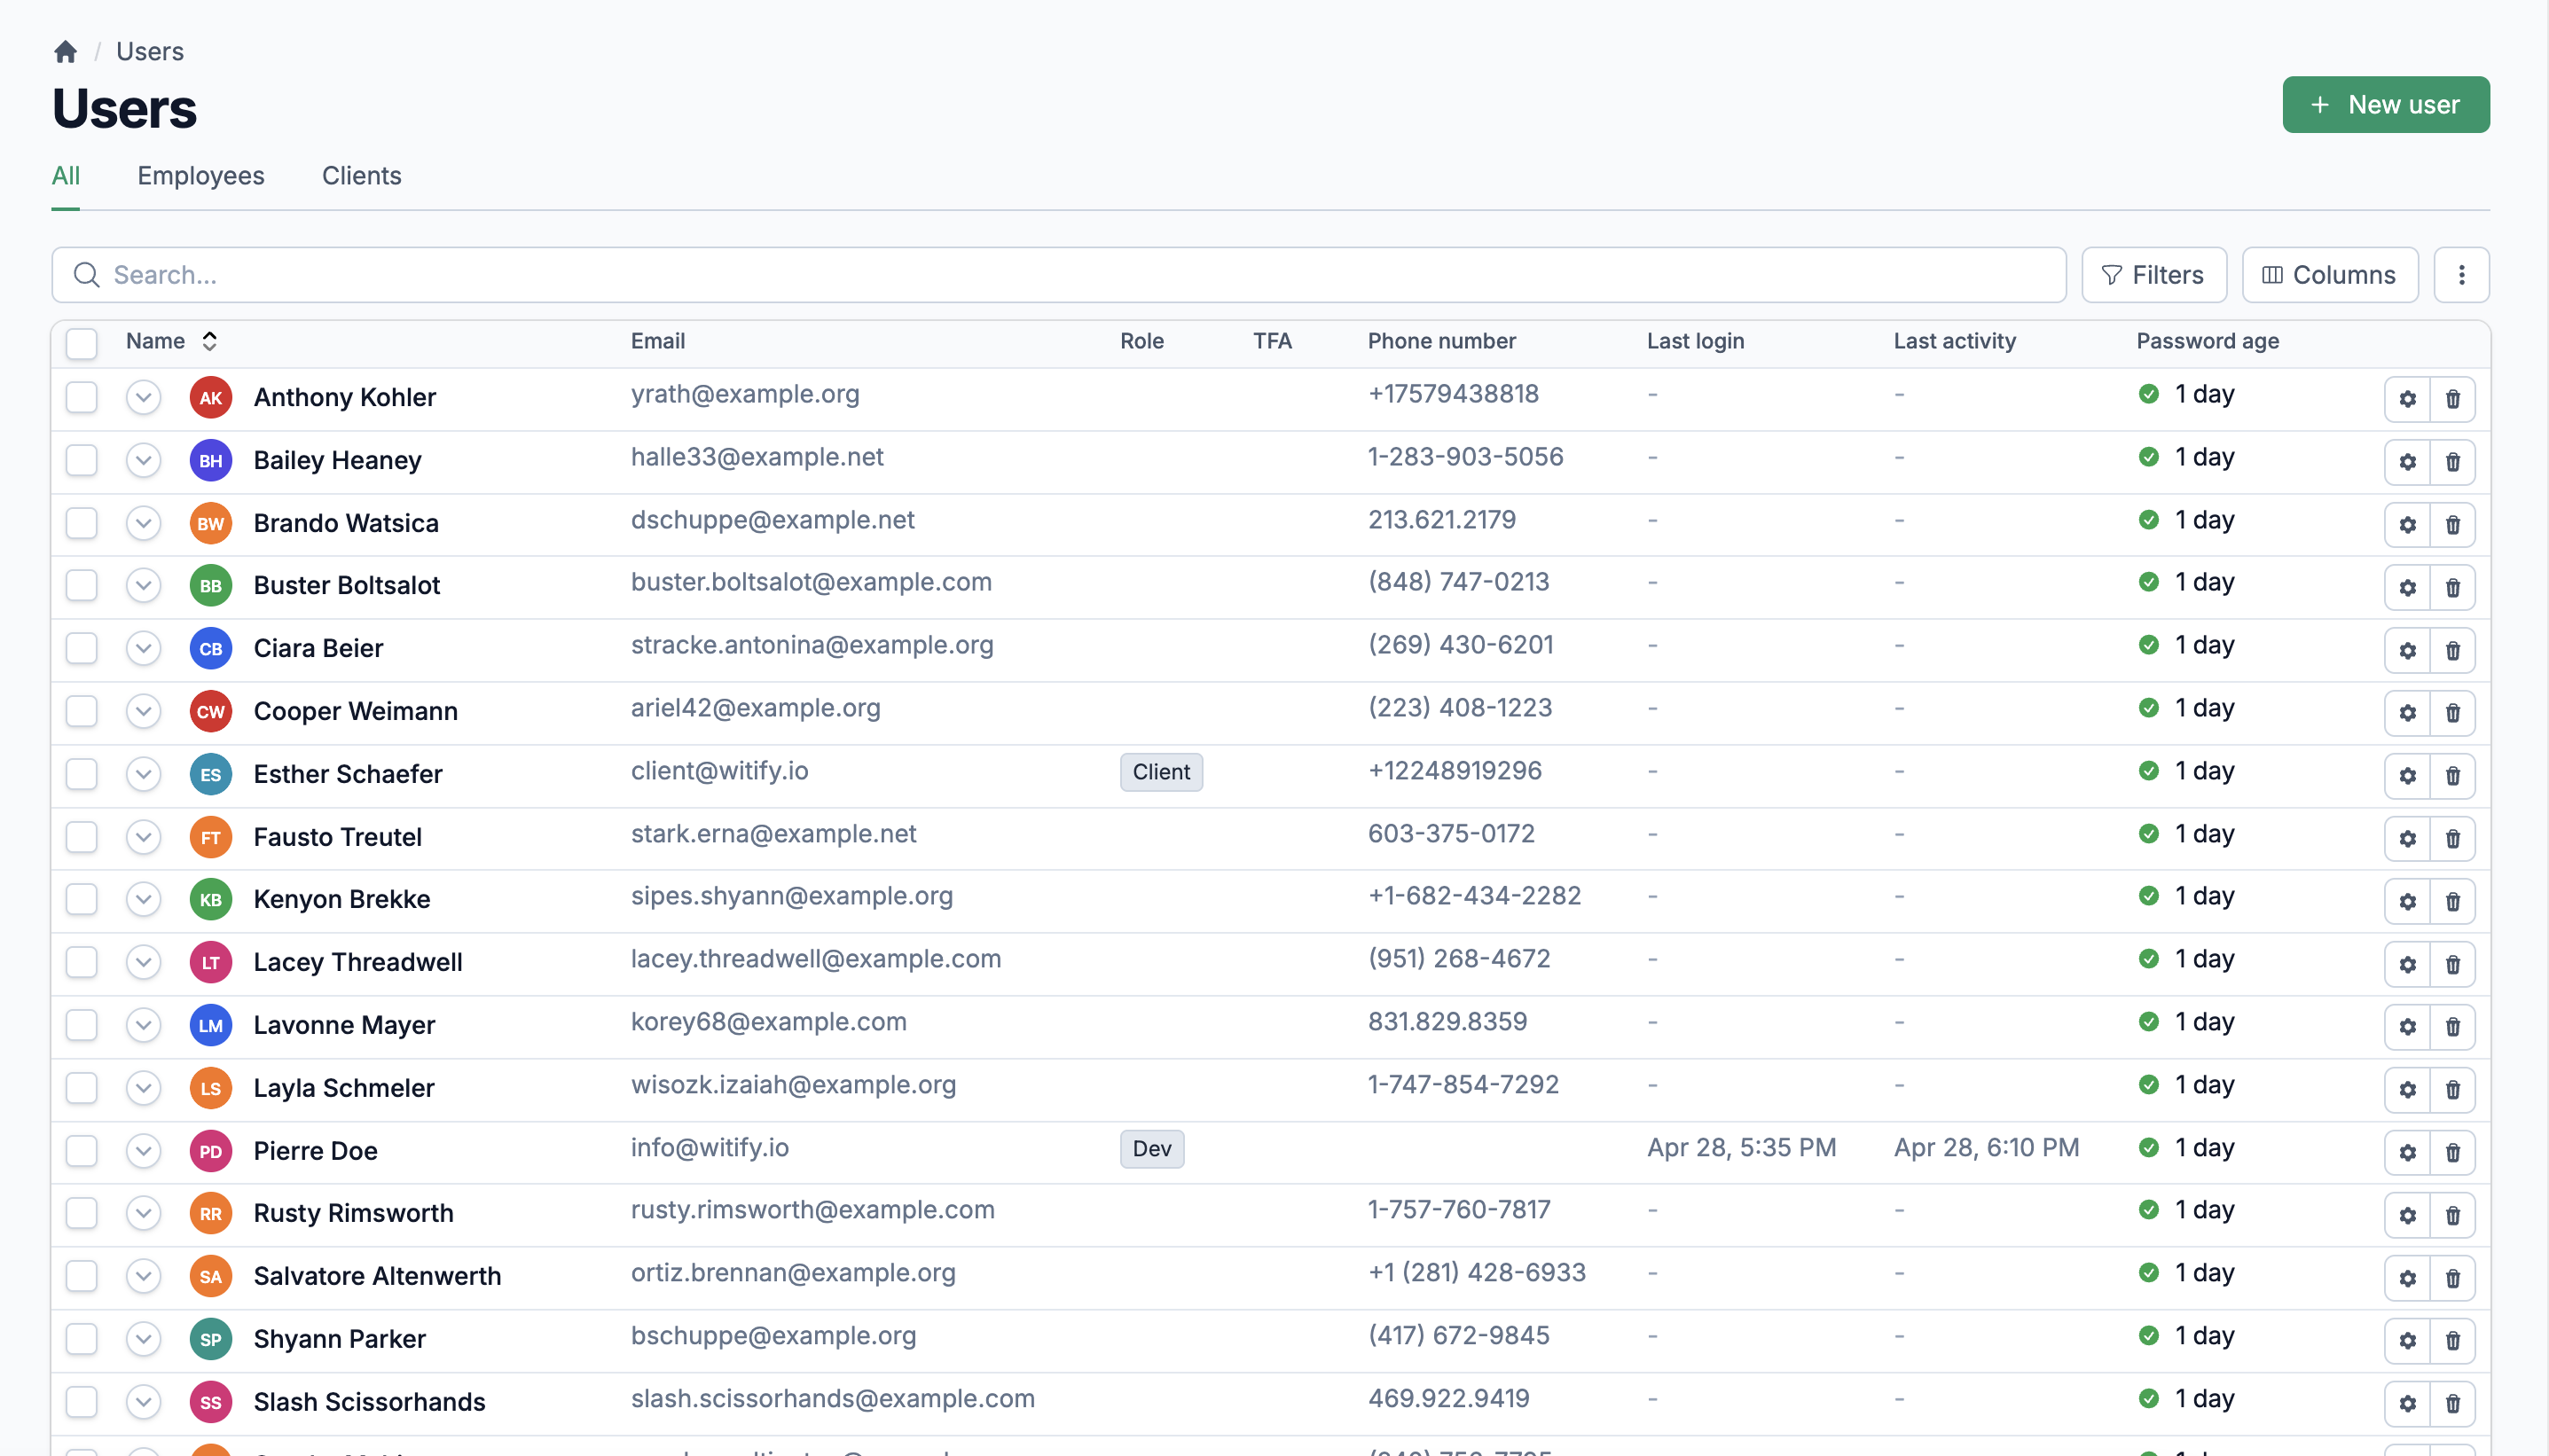
Sales & Profitability by Client
Revenue, cost, and profit margin per client. Includes item category breakdowns so you can see which product lines drive margin and which ones erode it. Toggle to hide clients without invoices.
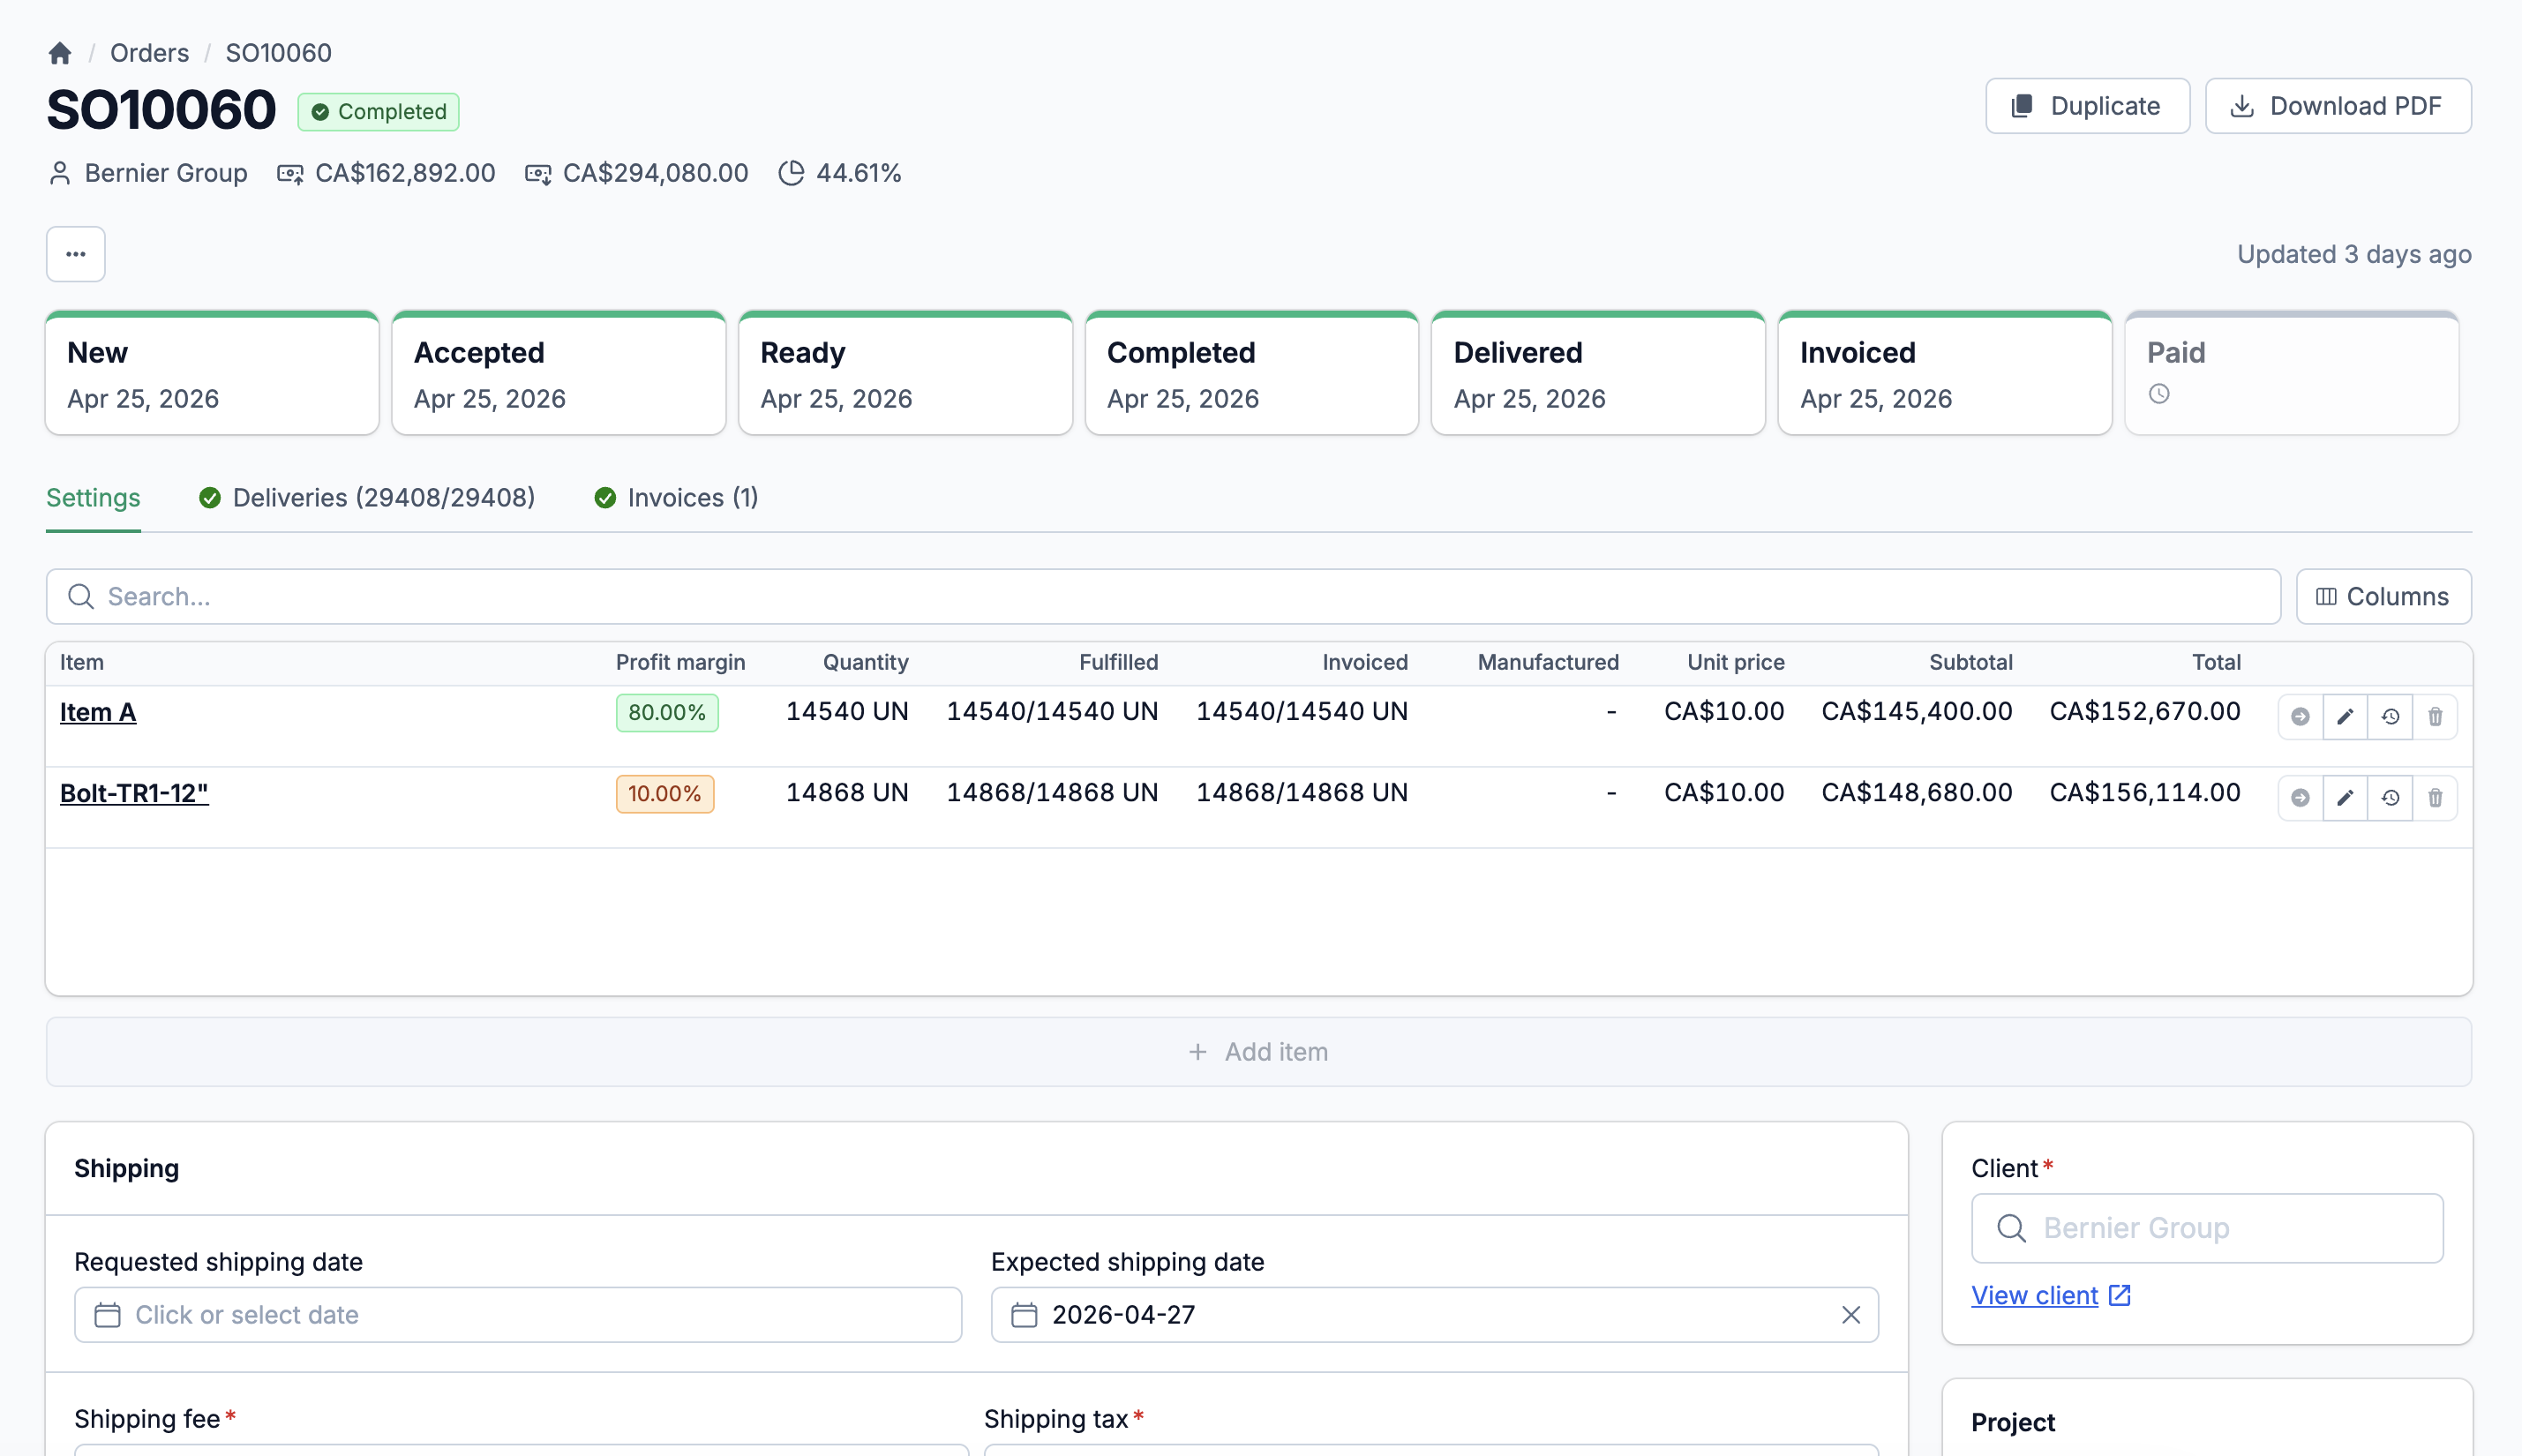
Details of Sales & Profitability
Invoice-level detail: document number, posted date, item count, quantity, subtotal, shipping, revenue, cost, and profit margin. Filter by specific client or by client opening date range.
Credits by Client
Credit amounts and after-tax totals per client over any date range. See who is getting credits and how much they total. Exportable in all four formats.
Purchases by Provider
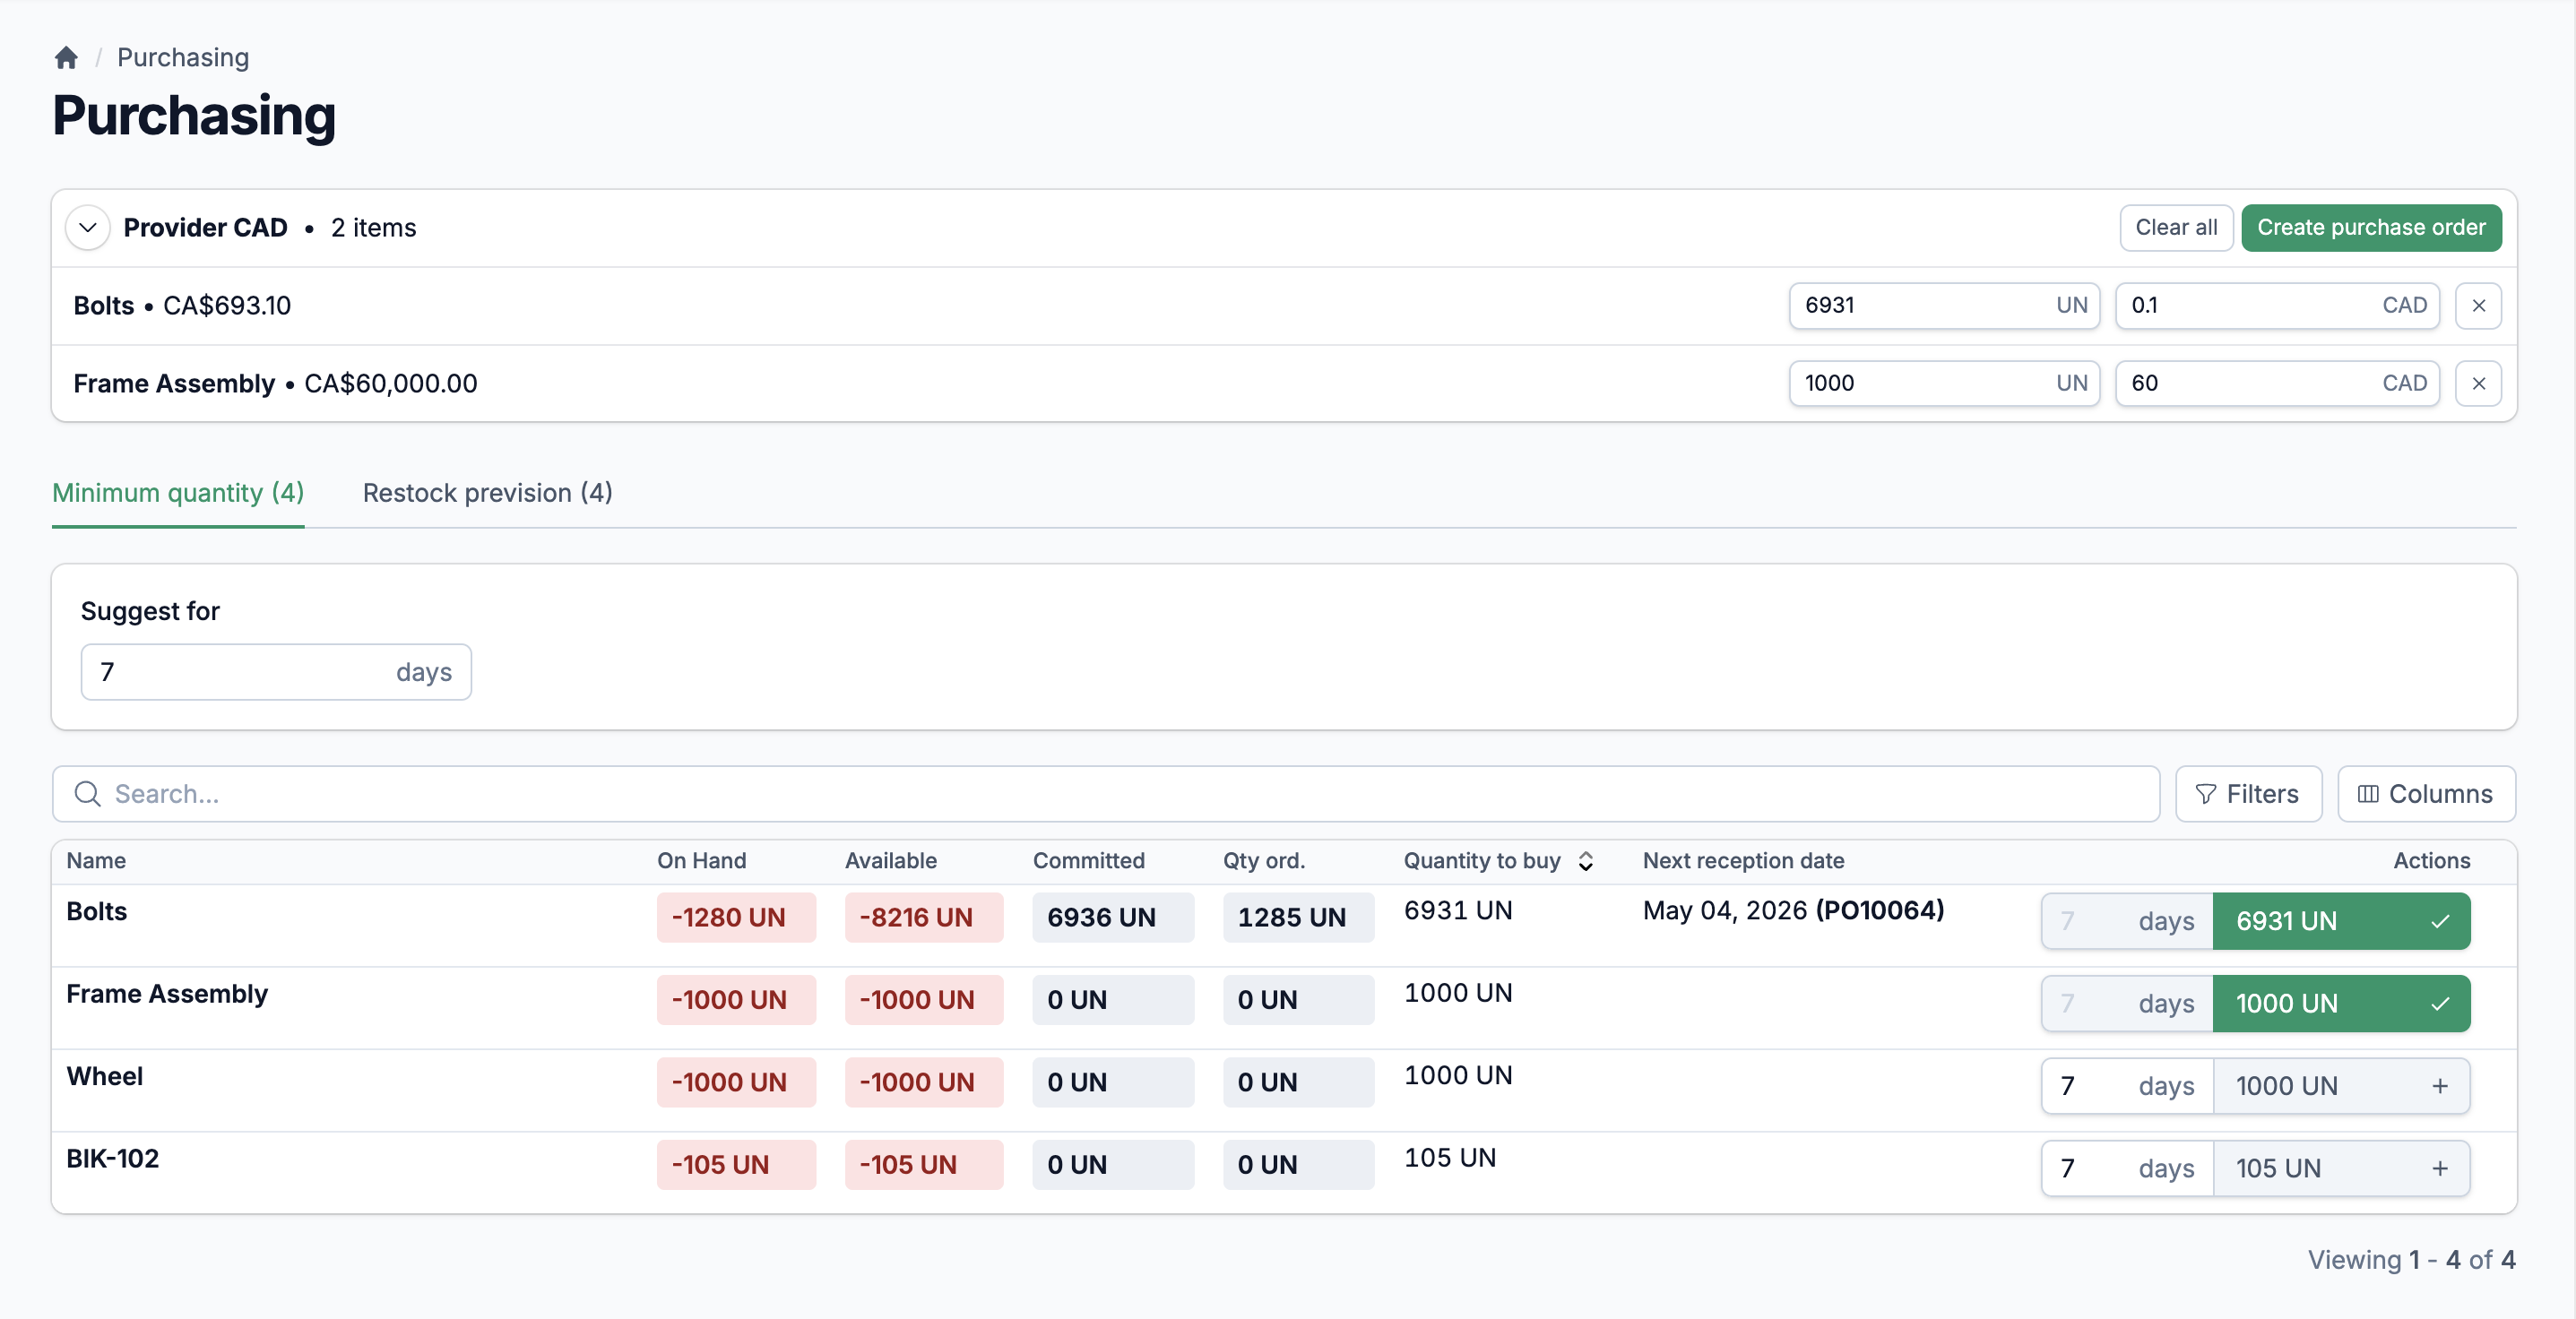
Spending totals per supplier: number of completed POs, distinct item count, delivered quantity, subtotal, shipping, and total. Includes average delivery time in days so you can compare supplier performance side by side.
Purchase Order Details
Drill into individual POs for a single provider: order number, creation date, completion date, delivery time, ordered vs. delivered quantities, and cost breakdown. Line-level detail with full currency support for multi-currency suppliers.
Multi-currency aware
Every purchasing report displays amounts in the supplier's own currency. When your French supplier invoices in EUR and your local one in CAD, each report line shows the right currency code.
Compare what you planned to spend with what you actually spent
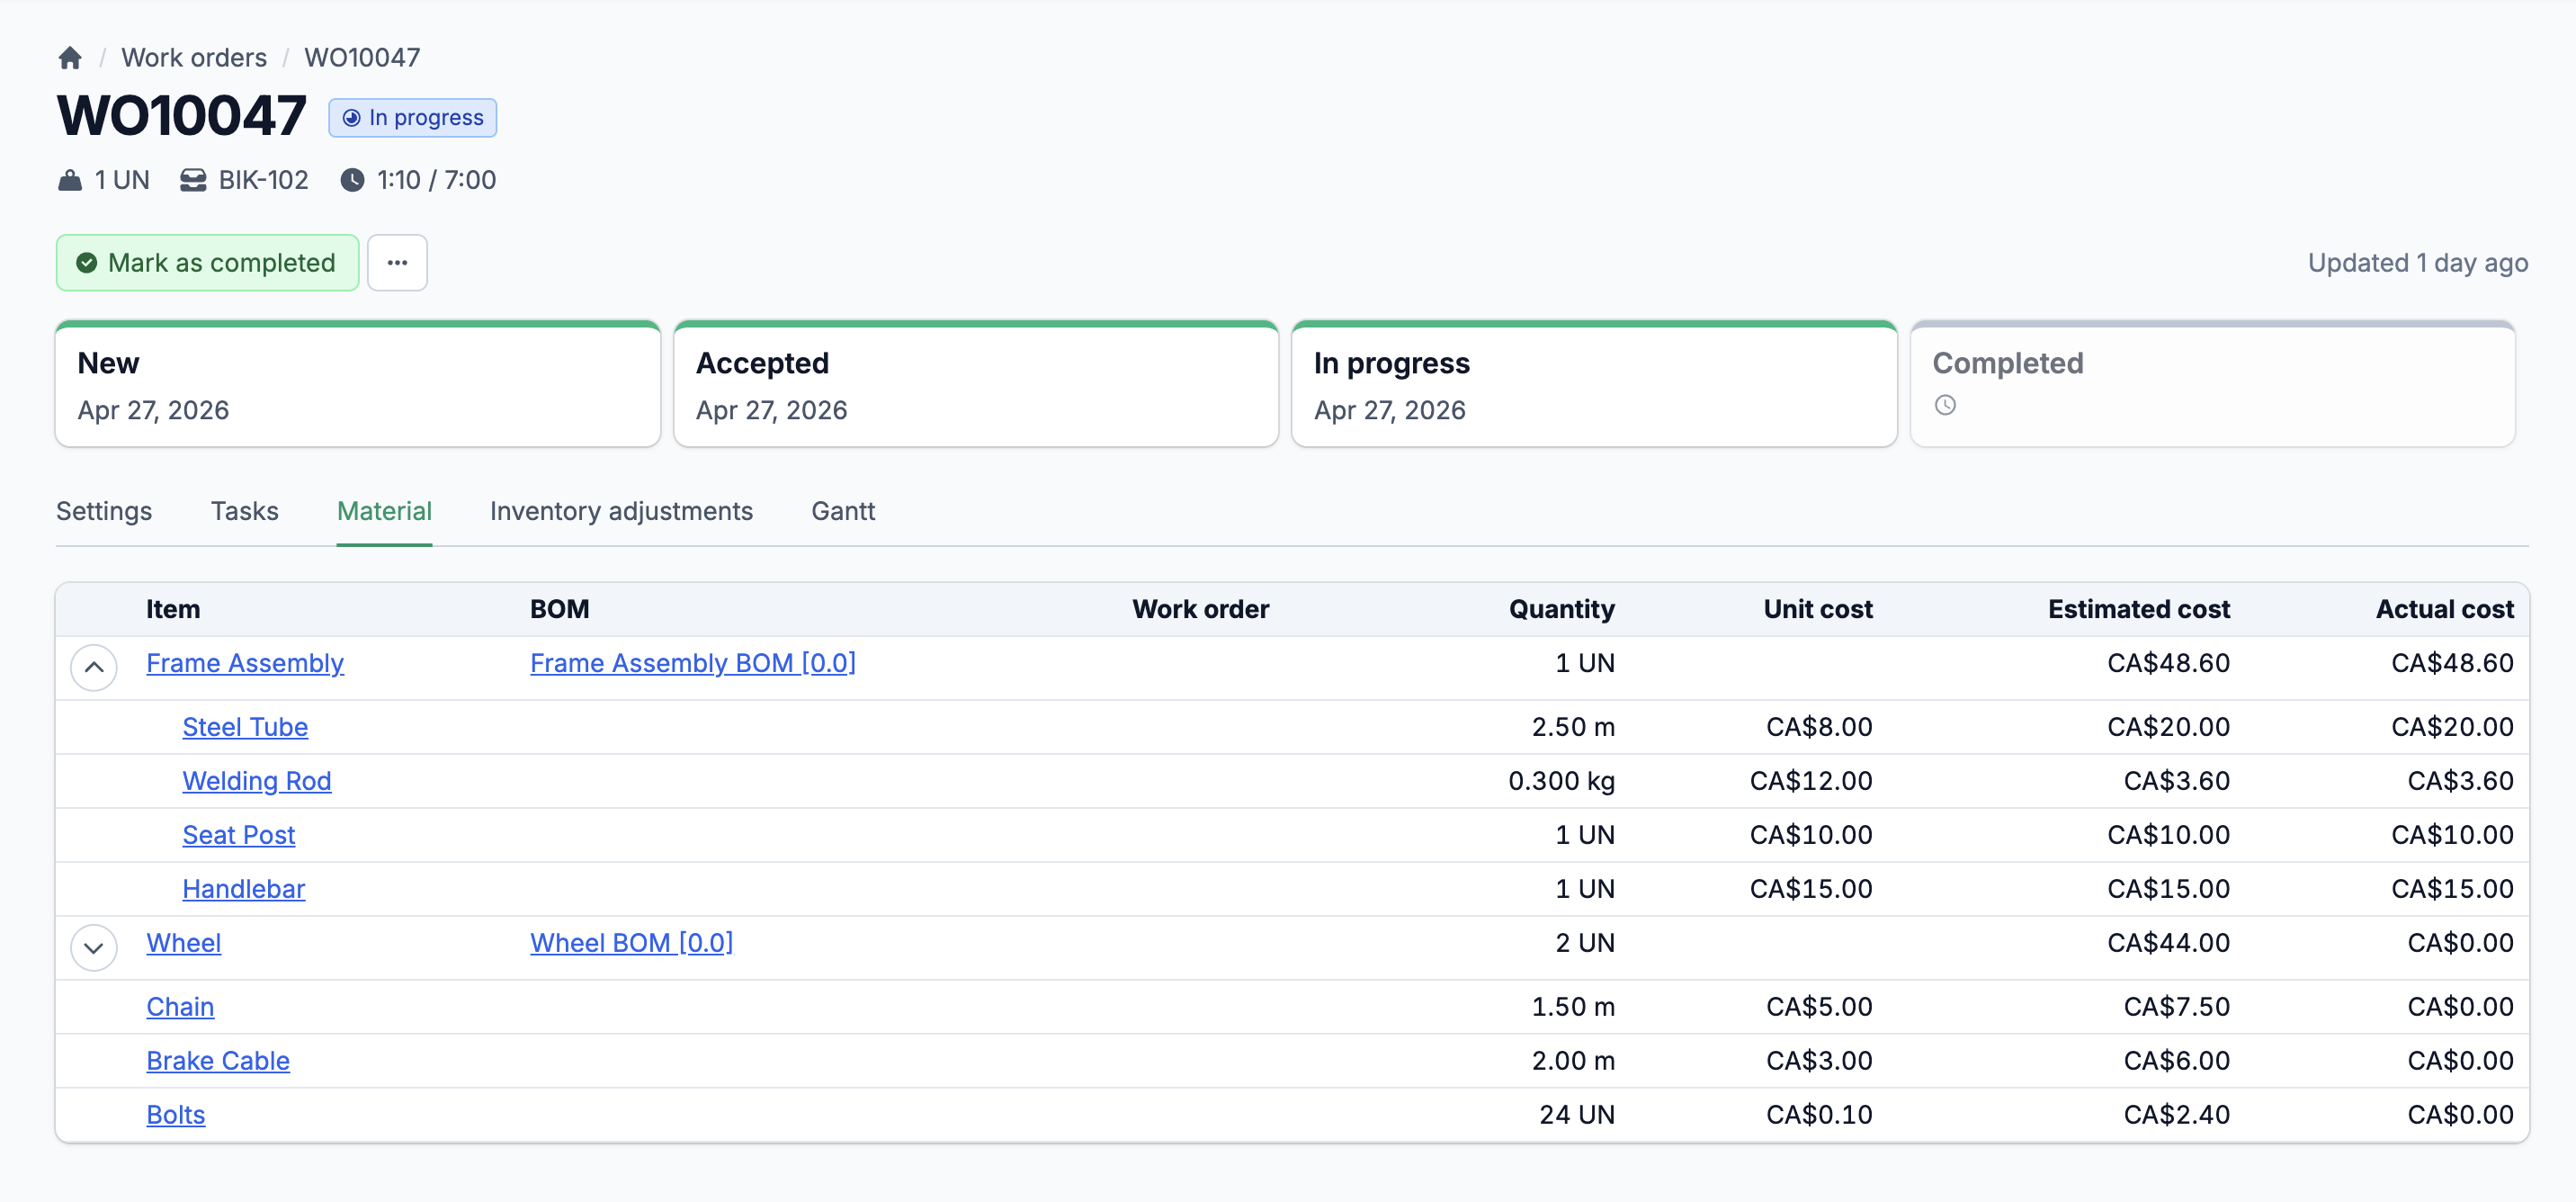
The Work Order Cost Variance report lines up estimated and actual costs for every completed work order. Material, overhead, and labor costs, each shown as both a dollar amount and a percentage variance. You see which jobs came in under budget and which ones blew past the estimate. Purchase price variance (PPV) analysis tracks the difference between what you expected to pay for materials and what you actually paid, calculated automatically when bills are posted.
Estimated vs. actual, side by side
Every completed work order shows estimated material cost, overhead cost, labor cost, and effort alongside the actuals. The variance columns do the math for you. Positive means over budget. Negative means savings.
22 columns per work order
Doc number, quantity, item, SKU, BOM, six estimated fields, six actual fields, and eight variance fields. The full picture of production cost performance, in one exportable table.
Purchase price variance built into billing
PPV is calculated per bill line when a bill is posted. The system compares the billed unit cost against the cost that was recorded at reception. Variances are stored in both document currency and base currency.
Track where your team's hours go
Two time reports cover different needs. The Timesheet Report shows time entries with flexible grouping. The Daily Punches report shows clock-in and clock-out records for attendance tracking.
Timesheet Report with group-by
Filter by employee, work category, project, and project tag. Group results by any of those four dimensions, or use two-level grouping (group by project, then by employee) for nested subtotals. Renders as HTML with formatted durations and grand totals.
Daily Punches attendance
See every punch-in and punch-out for selected employees over a date range. Duration in minutes, automatic punch-out flags, and sorting by time or employee. Useful for payroll review and attendance auditing.
Every item, measured from every angle
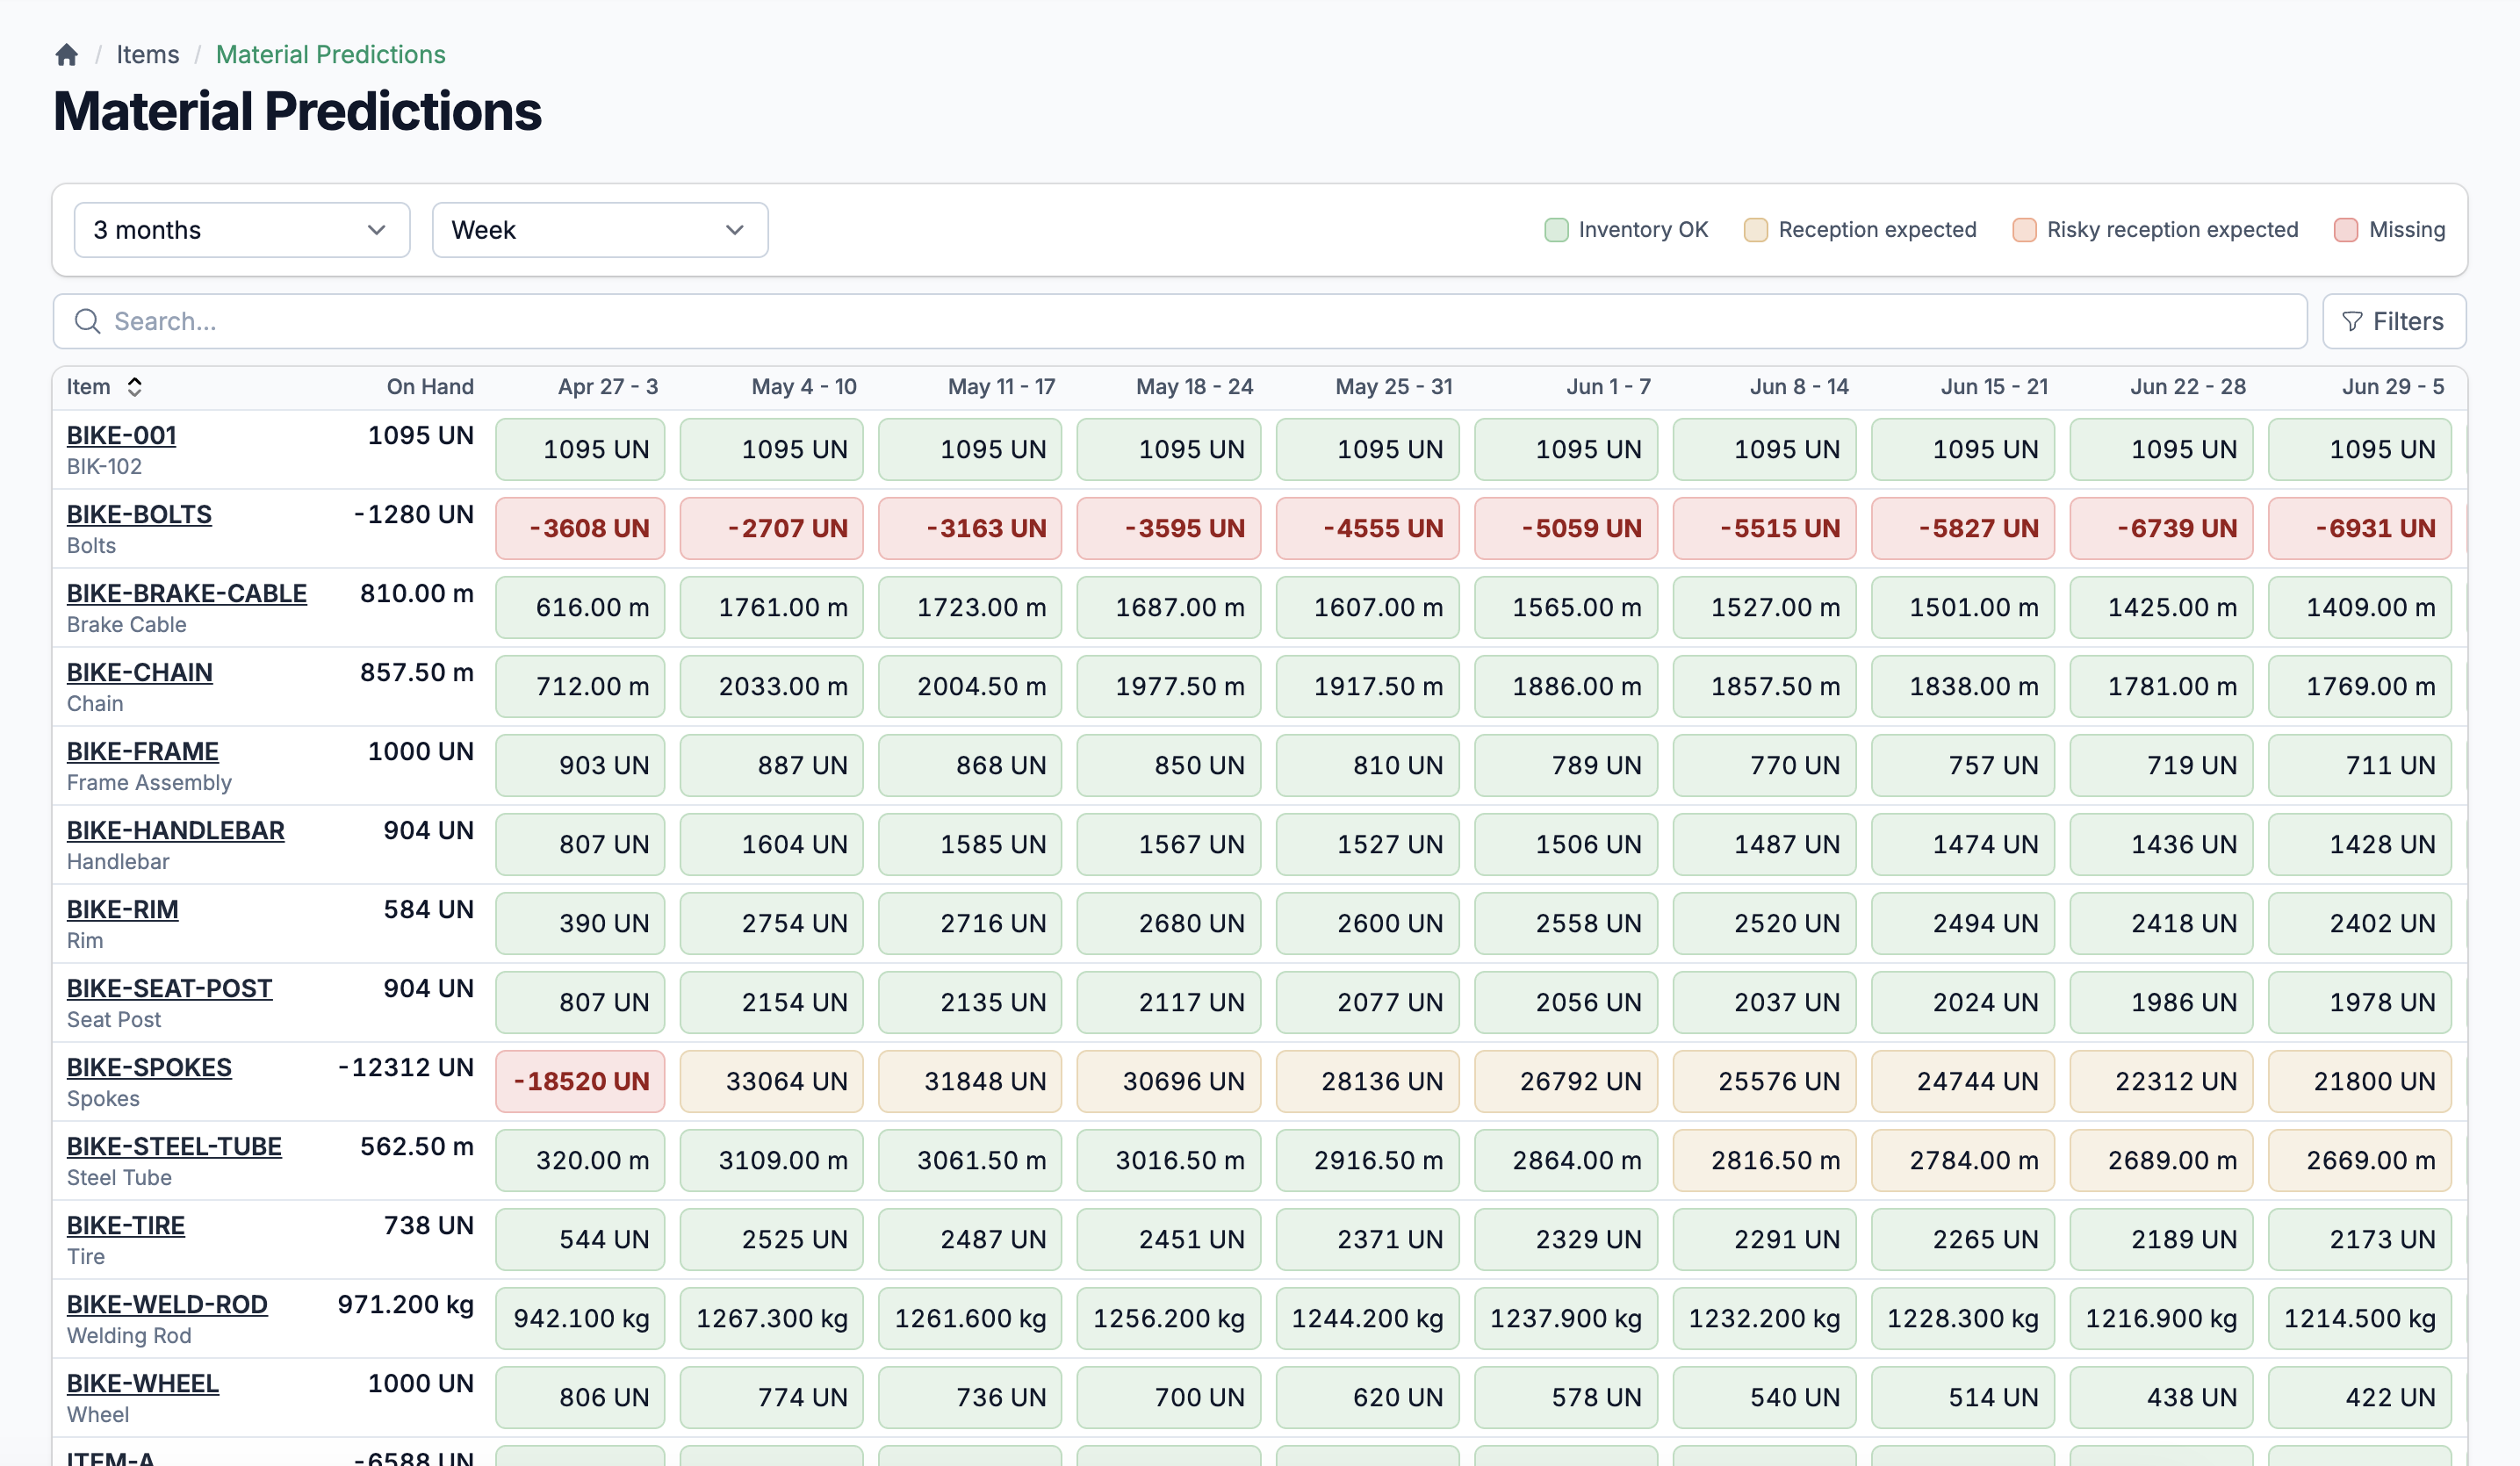
The Items Report shows per-item sales performance: orders count, ordered quantity, quantity delivered, quantity invoiced, revenue, cost, profit margin, and target margin. Filter by client or client opening date to isolate segments. Beyond the tabular report, each item page includes interactive stock charts, inventory value trends, and demand prediction graphs powered by the analytics engine. You see current stock with period-over-period trend badges, and a forecasting chart that maps expected inventory changes from open orders and incoming POs.
Time-series analytics on any model, any column, any period
The analytics engine is not a separate module. It runs inside the system, built into the dashboard, item pages, and every controller that has quantitative data. Point it at any date column, pick an aggregation function, choose a time grouping, and get a dataset back. It powers the sales graphs, margin charts, inventory value trends, and stock level charts you see across the application.
Group by day, week, month, or year
Pick the granularity that fits. Daily stock movements for operational decisions. Monthly sales totals for board reports. The engine handles the date math and fills in zero-value periods automatically.
Count, sum, or average aggregation
Count invoices per month. Sum revenue per quarter. Average delivery time per week. Three aggregation functions cover the questions your team actually asks.
Cumulative and retroactive modes
Cumulative mode shows running totals over time. Retroactive mode includes all data before the selected range in the starting value. Together, they produce inventory-style charts where the line shows your actual position, not just the period's delta.
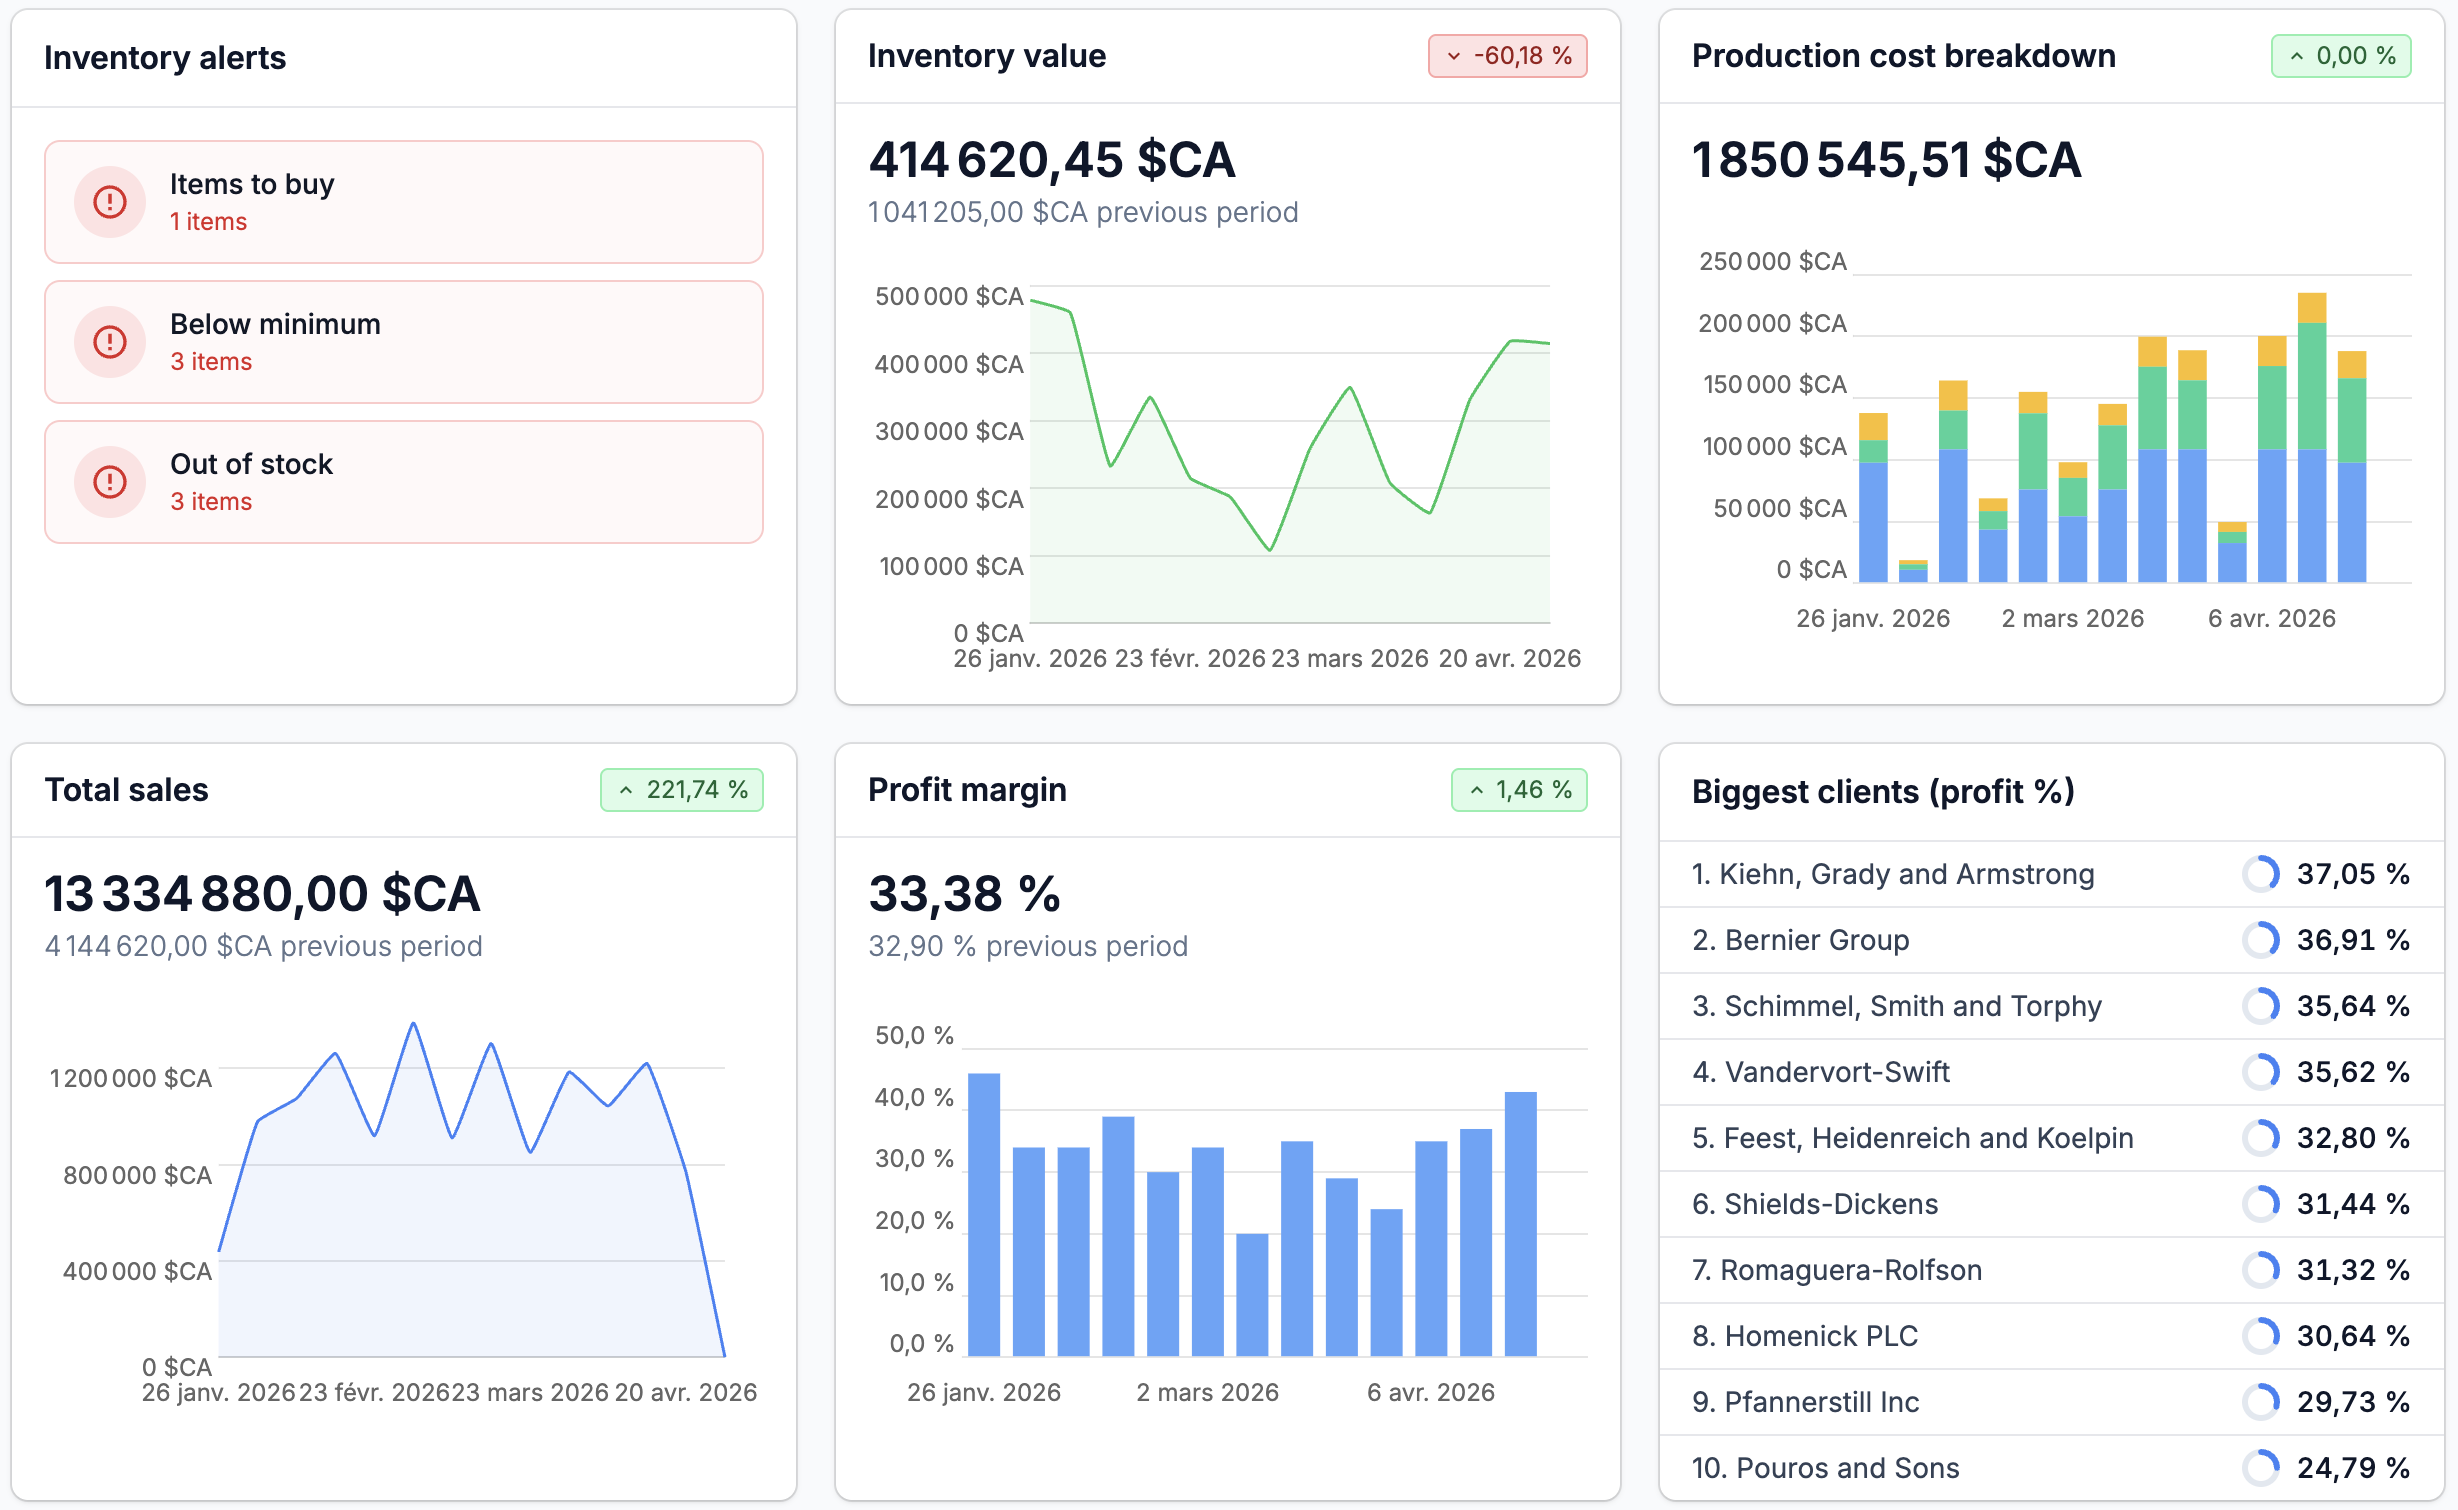
Dashboard with period comparison
The main dashboard shows sales, profit margin, biggest clients by revenue, biggest clients by profit, inventory value, and low-stock alerts. Every graph supports period-over-period comparison, so you can set this quarter vs. last quarter and see the trend immediately.